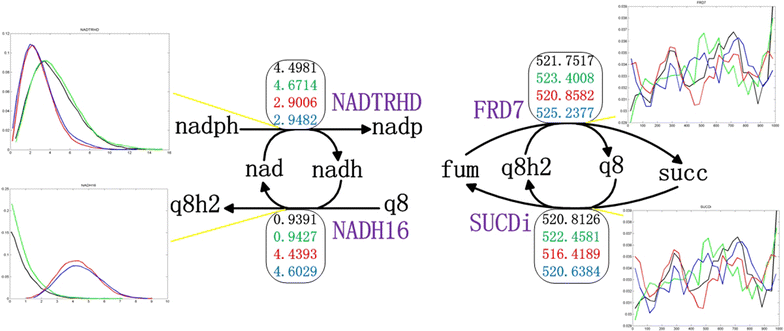
Fig. 3
From: In silico profiling of cell growth and succinate production in Escherichia coli NZN111

Two loops to couple NADH/NAD+ and succinate production under anaerobic conditions. The abbreviations and arrows in black color represent metabolites and reactions, respectively. The abbreviations in purple refer to the reaction names. The rectangles and histograms denote the average flux values of reactions and the probability of reactions’ fluxes, respectively. Therein, the colors of both the numbers in the rectangles and the lines in the histograms stand for different strains: black, green, red, and blue indicate the wild-type E. coli, ldhA mutant, pflB mutant, and NZN111, respectively